
Ever wondered how scientists measure solution concentration by shining light through it? The link between absorbance and concentration is a cool scientific rule. It helps scientists do amazing things in many fields.
So, what’s the deal with absorbance and concentration? It’s all about the Beer-Lambert Law. This key rule in spectrophotometry lets scientists figure out how much of a substance is in a solution by seeing how much light it absorbs.
Scientists use this cool method to check out all sorts of things. From environmental samples to medicines. The Beer-Lambert Law shows that as concentration goes up, so does absorbance. This makes it easy to get exact numbers about what’s in a solution.
When light goes through a solution, some of it gets absorbed. This shows how much of the substance is in there. By knowing this, scientists can learn a lot in chemistry, biology, and more.
Key Takeaways
- Absorbance is directly proportional to concentration
- Beer-Lambert Law provides a mathematical framework for concentration analysis
- Light absorption reveals important information about solution composition
- This technique is widely used in scientific research and industrial applications
- Spectrophotometry enables precise quantitative measurements
Introduction to Absorbance and Concentration
Spectrophotometry is a key method in science. It looks at how light and chemical amounts are connected. It helps us understand how molecules work together and measure their amounts.
Definition of Absorbance
Absorbance shows how much light a solution absorbs at a certain wavelength. It’s calculated using the formula A = log(I0/I). Here, I0 is the light that hits the solution, and I is the light that gets through.
This rule lets scientists measure how much light a sample absorbs.
- Measured on a scale from 0 to 5
- Directly related to the concentration of a substance
- Critical in determining chemical properties
Definition of Concentration
Concentration is about how much of a substance is in a certain amount of solution. In spectrophotometry, how substances interact with light is key. Concentration is usually shown in moles per liter (mol/L).
“The connection between absorbance and concentration provides powerful insights into chemical composition.” – Scientific Research Perspective
Importance in Analytical Chemistry
The link between absorbance and concentration helps scientists do precise measurements. They use spectrophotometry to:
- Determine chemical concentrations
- Assess oxidation levels
- Monitor molecular transformations
By knowing how light absorption works, scientists can get important details about chemical systems very accurately.
Key statistic: Beer’s law can show very small errors in absorbance, less than 0.1%. This shows how precise this method is.
The Beer-Lambert Law Explained
The Beer-Lambert law is a key concept in analytical chemistry. It shows how absorbance and concentration of a solution are linked. This principle helps scientists understand light’s interaction with chemicals during spectroscopic tests.
The law shows a vital mathematical link between light absorption and sample traits. Scientists use it to measure solution concentrations through optical tests.
Statement of the Law
The Beer-Lambert law is expressed as A = εLc. Here:
- A is absorbance
- ε (epsilon) is the molar absorptivity coefficient
- L is path length
- c is concentration
Key Variables Involved
Knowing the variables in the Beer-Lambert law is key for precise spectroscopic analysis. The law’s linear relationship lets researchers find unknown concentrations with great accuracy.
| Variable | Description | Impact on Measurement |
|---|---|---|
| Molar Absorptivity (ε) | Material-specific constant | Determines light absorption capacity |
| Path Length (L) | Distance light travels through sample | Directly influences absorbance magnitude |
| Concentration (c) | Amount of substance in solution | Proportional to light absorption |
Applications of the Law
The Beer-Lambert law is used in many scientific fields. It’s applied in:
- Environmental monitoring
- Chemical analysis
- Pharmaceutical research
- Clinical diagnostics
“The Beer-Lambert law provides a powerful tool for quantitative chemical analysis, bridging theoretical understanding with practical measurement techniques.”
By grasping the Beer-Lambert law’s linear relationship, scientists can accurately measure solution concentrations in various research areas.
How Absorbance is Measured
Spectrophotometry is key in many scientific fields. It helps us understand how much light substances absorb. Scientists use special tools to measure this light absorption.

Today, we have advanced tools for measuring light absorption. These tools are vital for accurate tests in chemistry and biology.
Instruments for Absorbance Measurement
Here are some main tools for measuring absorbance:
- Spectrophotometers
- Colorimeters
- Optical density readers
- UV-Visible spectrometers
Factors Affecting Measurement Accuracy
Several things can affect how accurate absorbance measurements are:
- How well the sample is prepared
- How well the instrument is set up
- The wavelength chosen
- How clean the cuvette is
- The environment around the test
| Measurement Factor | Impact on Accuracy |
|---|---|
| Sample Purity | High impact |
| Instrument Calibration | Critical |
| Temperature Stability | Moderate impact |
Precision in spectrophotometry requires careful attention to details and strict measurement rules.
Getting the right wavelength and keeping conditions steady is crucial. Researchers must control variables well to get reliable results.
New spectrophotometry methods are being developed. They offer better ways to study light absorption in different scientific areas.
The Relationship Between Absorbance and Concentration
Understanding how absorbance and concentration are linked is key in analytical chemistry. Scientists use light absorption to measure substance concentration with great accuracy.
The link between absorbance and concentration is straightforward. As the substance’s concentration goes up, so does its absorbance. This happens in a straight line.
Direct Proportionality Explained
The Beer-Lambert Law explains this connection. It shows that absorbance (A) is directly tied to concentration (c) through a simple equation:
- A = εbc
- A = Absorbance (dimensionless)
- ε = Molar absorptivity (L mol^-1 cm^-1)
- b = Path length of sample (cm)
- c = Concentration of substance (mol L^-1)
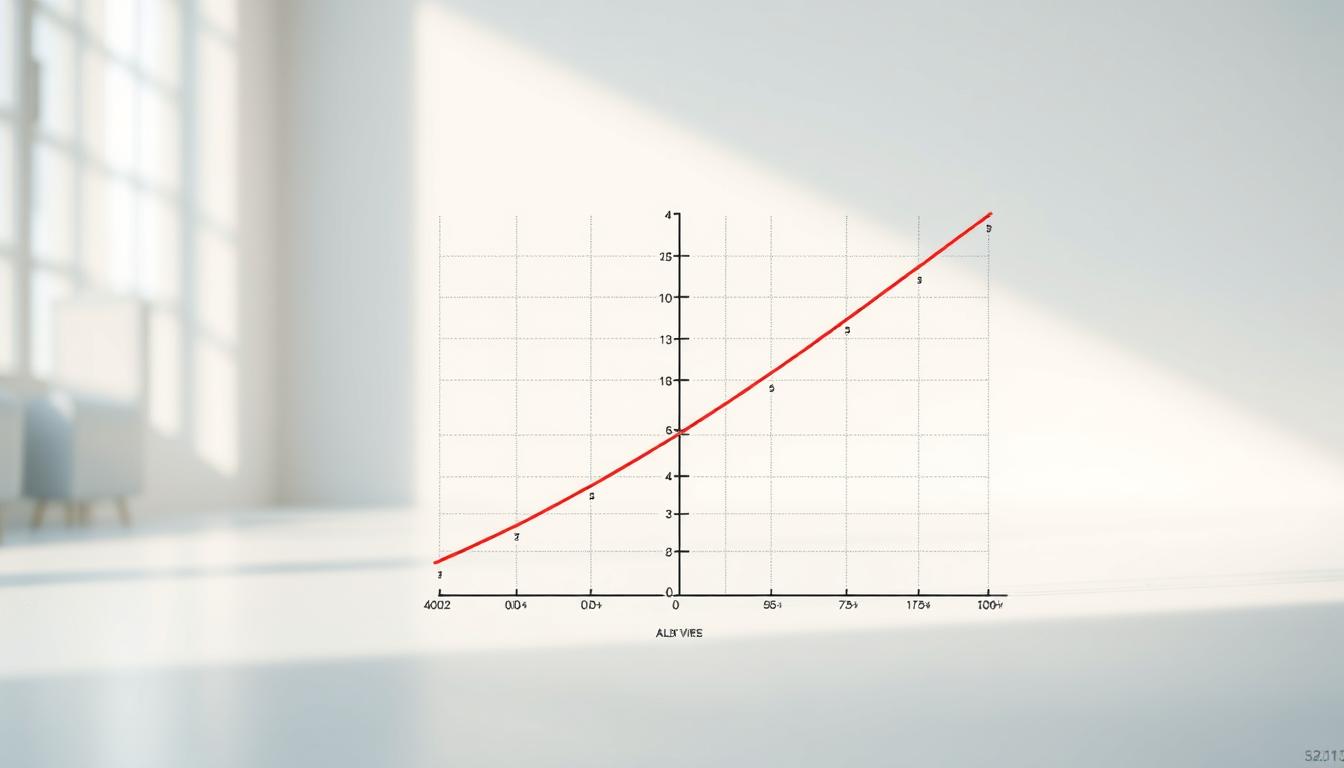
Graphical Representation of Concentration Determination
When you plot absorbance against concentration, you get a straight line. This line starts at zero, showing that no substance means no absorbance.
| Concentration (units) | Transmittance (%) | Optical Density |
|---|---|---|
| 1 | 50% | 0.3 |
| 2 | 25% | 0.6 |
| 3 | 12.5% | 0.9 |
Note: The most accurate concentration measurements are below 2.0 units of absorbance. Higher values can break the linear relationship.
“The beauty of the absorbance-concentration relationship lies in its simplicity and predictability.” – Analytical Chemistry Insights
Factors Influencing Absorbance
Understanding absorbance measurement is complex. It involves many environmental and instrumental factors. Scientists must focus on key parameters to ensure accurate spectroscopic analysis.
Wavelength Selection
Wavelength is crucial in absorbance measurement. Each chemical has unique light absorption properties. Researchers need to pick the right wavelength for precise measurements.
- Peak wavelength provides maximum sensitivity
- Different compounds absorb light at specific wavelength ranges
- Visible spectrum (400-700 nm) offers diverse analytical opportunities
Sample Path Length
The path length of a sample affects absorbance readings. Standard cuvettes have a 1 cm path length. This is a reference for dilution factor calculations.
“Accurate path length measurement is essential for reliable spectroscopic analysis.” – Analytical Chemistry Principles
Temperature and Environmental Conditions
Environmental factors greatly impact spectroscopic measurements. Temperature changes can alter molecular interactions and light absorption.
- Temperature changes impact molecular energy states
- Humidity can introduce measurement variations
- Consistent environmental conditions ensure reproducibility
By managing these factors, researchers can improve their absorbance measurements. This leads to more reliable analytical results.
Importance of Calibration Curves
Calibration curves are key in finding out how much of something is in a sample. They turn raw data from spectrophotometers into exact amounts of unknown substances.

Scientists use calibration curves to link how much light is absorbed to known amounts. They do this in several steps:
- Make standard solutions with known amounts
- Measure how much light each solution absorbs
- Plot light absorption against known amounts
- Get a linear equation from the data
Creating a Calibration Curve
To make a calibration curve, researchers take a careful method. They use five different concentration levels for better results. The equation y = mx + b lets them guess unknown amounts from the curve.
“A well-constructed calibration curve is the cornerstone of accurate quantitative analysis.” – Analytical Chemistry Research Journal
How Calibration Impacts Accuracy
Getting the right amount of something depends a lot on calibration. Important things that affect how well calibration works include:
- Choosing the right standard solutions
- How sensitive the instrument is
- The environment around the test
- How well the measurements are taken
By following strict calibration steps, researchers can get up to 98% right in their measurements. The R² value shows how good the data is, with 0.95 to 0.99 being very good.
Practical Applications of Absorbance and Concentration
Colorimetric assays are key in many scientific fields. They help researchers measure substances with great detail. The link between absorbance and concentration is a powerful tool in science.
Environmental Monitoring
Scientists use colorimetric assays to find and measure pollutants. They check water quality by looking at:
- Heavy metal levels
- Pollutants in water bodies
- Soil chemical makeup
Clinical Diagnostics
Medical labs use absorbance to diagnose diseases. Spectrophotometric methods help find:
- Blood sugar levels
- Enzyme activity
- Protein amounts in samples
| Field | Primary Application | Key Measurement Technique |
|---|---|---|
| Environmental | Contaminant Detection | Spectrophotometry |
| Clinical | Disease Marker Identification | Colorimetric Assays |
| Pharmaceutical | Drug Concentration Analysis | Absorbance Measurement |
Pharmaceutical Analysis
Pharmaceutical researchers use colorimetric assays to check drug quality. They look at:
- Drug development screening
- Quality control testing
- Stability of pharmaceuticals
The precision of absorbance measurements lets scientists spot tiny changes in concentration.
Limitations of the Absorbance-Concentration Relationship
Spectrophotometry uses the beer-lambert law to measure chemical concentrations. But, it has big limitations. The link between absorbance and concentration isn’t always clear or straight.
- Non-linear responses at high concentrations
- Interactions between chemical species
- Instrumental measurement constraints
- Environmental interference factors
Non-linear Response Characteristics
The beer-lambert law works well for solutions up to 0.02 M. But, at higher concentrations, molecules start to interact and change how they absorb light. This makes it hard to get accurate readings.
Challenges in Complex Mixtures
Dealing with complex chemical mixtures is tough for spectrophotometry. When many chemicals are together, they:
- Change how light is absorbed
- Make unexpected spectral interference
- Lower the precision of measurements
“Analytical chemistry demands rigorous understanding of method limitations”
| Concentration Range | Linearity Status | Potential Errors |
|---|---|---|
| < 0.02 M | High Linear Correlation | Minimal Deviation |
| 0.02 – 0.1 M | Moderate Linearity | Increasing Error Potential |
| > 0.1 M | Significant Non-linearity | Substantial Measurement Error |
To get good results with spectrophotometry, you need to know these limits well. This helps ensure your chemical measurements are accurate and reliable.
Advanced Techniques in Absorbance Measurement
Spectrophotometry is getting better, offering new ways to analyze things more accurately. Today’s science needs advanced tools to understand complex molecules better.

The world of spectrophotometry has changed a lot. New methods have come along, making our analysis better:
- Multi-wavelength spectrophotometry
- Derivative spectroscopy
- Rapid scanning techniques
- High-resolution spectral analysis
Emerging Spectrophotometry Technologies
New spectrophotometry methods are changing science. They help us find molecules more accurately than ever before.
“The future of spectrophotometry lies in its ability to provide molecular insights with extraordinary precision.” – Scientific Research Journal
Innovative Analytical Approaches
Modern spectrophotometry goes beyond old ways. It uses smart algorithms and new optics to:
- Detect tiny changes in concentration
- Study complex mixtures of molecules
- Reduce effects of the environment
- Make measurements more sensitive
Combining computers with spectrophotometry is a big step forward. These new tools will open up new areas in chemistry, biochemistry, and materials science.
Conclusion: The Significance of Understanding This Relationship
The link between absorbance and concentration is key in scientific research. It gives researchers tools for exact chemical measurements in many fields.
Understanding this relationship shows us important parts of analytical chemistry:
- Direct proportionality between concentration and absorbance
- Critical role in scientific measurement techniques
- Essential for accurate quantitative analysis
Summary of Scientific Significance
The Beer-Lambert Law shows a clear link where absorbance grows with concentration. This helps scientists:
- Determine unknown concentrations
- Validate experimental results
- Develop strong analytical methods
Future Research Implications
New technologies are making spectroscopic techniques better. Researchers look forward to:
- Nanotechnology-enhanced spectroscopy
- Advanced computational modeling
- Precision measurement instruments
“The ability to precisely measure concentration through absorbance opens doors to unprecedented scientific discoveries.” – Scientific Research Quarterly
| Field of Application | Quantitative Analysis Potential |
|---|---|
| Environmental Monitoring | High precision pollutant detection |
| Medical Research | Advanced diagnostic techniques |
| Pharmaceutical Development | Compound concentration verification |
As science gets better, the basics of measuring absorbance and concentration will keep being vital. They will help drive new discoveries in many areas of research.
FAQs Regarding Absorbance and Concentration
Analytical chemists and researchers often face complex questions about absorbance and concentration. The Beer-Lambert law helps clear up common misconceptions. It also gives deeper insights into spectroscopic techniques.
Fundamental Questions About Absorbance Measurements
Scientists and students often ask about the details of absorbance calculations and the Beer-Lambert law. Let’s look at some key questions that come up during spectroscopic analysis.
- What exactly is molar absorptivity?
- How does concentration impact light absorption?
- What are the limitations of the Beer-Lambert law?
Understanding Molar Absorptivity
Molar absorptivity shows how well a substance absorbs light at a specific wavelength. It’s a key part of the Beer-Lambert law. For example, a molar absorptivity of 8400 M⁻¹cm⁻¹ means it absorbs a lot of light.
| Parameter | Value | Significance |
|---|---|---|
| Molar Absorptivity (ε) | 8400 M⁻¹cm⁻¹ | Indicates strong light absorption |
| Wavelength (λ) | 275 nm | Maximum absorption point |
| Concentration (c) | 8.33 x 10⁻⁵ mol/L | Calculated using Beer-Lambert law |
Common Misconceptions Clarified
Many researchers get the Beer-Lambert law wrong. It assumes a direct link between absorbance and concentration. But real-world data can differ due to molecular interactions and instrument limits.
The Beer-Lambert law gives a theoretical base, but real measurements need careful thought of experimental conditions.
Practical Limitations
The Beer-Lambert law doesn’t work well at high concentrations. Things like stray radiation, molecular interactions, and instrument specs can make measurements not follow the ideal line.
- High concentrations can make measurements less accurate
- Molecular interactions can make predictions hard
- Instrument bandwidth can affect absorbance readings
Knowing these details helps researchers use the Beer-Lambert law better in spectroscopic analysis. It shows both its strengths and its weaknesses.
References for Further Reading
Researchers looking into spectrophotometry and colorimetric assays have many resources to explore. The scientific world offers deep insights into how light absorption relates to chemical concentration. This knowledge is vital for those working in analytical chemistry.
Recommended Scientific Literature
Leading analytical chemistry journals dive deep into spectrophotometric techniques. They publish articles on the Beer-Lambert law, molecular interactions, and precise colorimetric assays. Libraries and online databases have vast collections of research papers on spectroscopic analysis.
Online Research Databases
Online platforms have vast amounts of research on spectrophotometry. Databases like PubMed Central, Web of Science, and Google Scholar offer access to the latest research. They help researchers keep up with new findings and understand complex concentration and light absorption relationships.
FAQ
What is the Beer-Lambert Law?
The Beer-Lambert Law is a key principle in spectrophotometry. It shows how the absorbance of a solution relates to its concentration. It says that absorbance goes up with the concentration and the path length of the sample.
How does absorbance relate to concentration?
Absorbance and concentration are directly related. When the concentration of a solution goes up, so does its absorbance. This is true as long as other factors stay the same. Scientists can figure out a substance’s concentration by measuring its absorbance.
What instruments are used to measure absorbance?
Spectrophotometers are the main tools for measuring absorbance. They pass light through a sample and measure how much light is absorbed. This helps calculate the substance’s concentration.
What factors can affect absorbance measurements?
Several things can change absorbance readings. These include:
– The wavelength of light used
– The path length of the sample
– Temperature
– How pure the sample is
– The instrument’s calibration
– Any substances that might interfere
What is a calibration curve in spectrophotometry?
A calibration curve shows how known concentrations of a standard solution relate to their absorbance. It helps find the concentration of unknown samples by comparing their absorbance to the standard curve.
What are some practical applications of absorbance measurements?
Absorbance measurements are used in many areas. These include:
– Monitoring the environment
– Diagnosing in clinics
– Analyzing pharmaceuticals
– Conducting chemical research
– Checking food and beverage quality
– Testing water quality
What are the limitations of the Beer-Lambert Law?
The Beer-Lambert Law has some limits. These include:
– It doesn’t work well at very high concentrations
– Other substances can interfere
– It might not work in complex mixtures
– It has limits in very concentrated or scattering solutions
How is molar absorptivity important in spectrophotometry?
Molar absorptivity shows how much a substance absorbs light at a specific wavelength. It’s key in the Beer-Lambert Law. It helps understand the relationship between absorbance, concentration, and path length.


Leave a Comment
Your email address will not be published. Required fields are marked *